
Fractally Right: Yes GDP Hides Manufacturing Decline

Recently I published an article in Palladium Magazine arguing that (1) pundits and popular economists have been inappropriately citing manufacturing GDP numbers, in particular the statistic called “real value-added: manufacturing” in order to dunk on Americans who believe that U.S. manufacturing is in decline and (2) the U.S. government statistical agencies also share blame for devising and promoting numbers that do not reliably tie back to the physical world, and then allowing these numbers to be so widely misused. This article sparked an enormous amount of discussion as well as criticism, including a particularly long and inexplicably vitriolic blog post that was boosted by large X accounts including Cremieux Recueil, Noah Smith, Roon, Eigenrobot, Alex Tabarrok, Armand Domalewski, Alex Nowrasteh, Milo Yiannopoulos, and others.
This pile-on by big accounts, including several economics-flavored pundits, gave layman passersby the impression that my article on this admittedly arcane topic was riddled with errors and disproven, to my supposed great embarrassment. Unfortunately for them, they clearly read neither my arguments nor my interlocutors’ very carefully, because this is not even close to being the case. It is he whose arguments are riddled with errors and misunderstandings that I will go over in excruciating detail, and we can start by first noting that none other than the former head of GDP calculation for the Bureau of Economic Analysis has reluctantly confirmed my thesis upon public interrogation. Critiquing experts as a layman is like pulling teeth, and they are liable to close ranks against any layman who does so, so I applaud him for his fair engagement and encourage the reader to carefully read through the rest of this long rebuttal to understand exactly why I am making the arguments I am.
If you want to skip to the fun part where I give whom we will call “Mr. Fractally Wrong” a taste of his own medicine, scroll down to Part 3 below.
Part 1: Vindication on Real Value-Added
The former head of GDP calculation for the Bureau of Economic Analysis responded to my post in a way which starts out critical but then unintentionally vindicates me. Fourteen posts into the thread he agrees with me that real value-added should not be used in the way people are using it.

He clarifies that it is not a measure of “output” and then he advises most people not to use it at all: “I do think most people citing real value added really should be using real output instead. Value added is a net concept, and it’s generally clearer to show what’s happened to real output and real intermediate inputs separately, rather than to their net value.” Nor does he endorse it as a metric of the “growth of manufacturing”, which is how the BEA web site communicates it. Brent Moulton addresses the question “How should ‘real value be interpreted?” but then he struggles to come with any use for it other than in reference to calculations of other numbers the BEA produces. He adds that real value-added was really meant for building the BEA’s “contributions to GDP growth” table. For debating questions of manufacturing health he prefers concepts like “output, employment, intermediate inputs, and productivity.”
It is nice that Brent Moulton responded to my article with these clarifications about the proper use of real value-added. But has he or anyone at the BEA ever actually sent these clarifications to the people who have been misusing the number?
For real value-added has been very greatly used and abused.
Wikipedia itself cites it as the key number in their article on U.S manufacturing, boasting of a “record high real output in 2024 of $2.913 trillion.” An economics professor and pundit at the American Enterprise Institute has cited real value-added to “setting a new all-time record high for America’s manufacturing output (see chart above).” and then tweeted a chart of real value-added saying it refuted arguments that America has deindustrialized.
Articles and opinion pieces in the L.A. Times, NY Times, Wall St Journal, an interview by a Federal Reserve economist (15 minutes in), economists blog Marginal Revolution, a Congressional Research Service report, all cite the real value-added figure in order to refute popular perceptions of manufacturing decline. Academic economists cite the number to make dunks. The NY Times calls it the “most precise measure of U.S. manufacturing.”
These two paragraphs from a 2016 opinion piece L.A. Times sum up how real value-added is being used in arguments:
American factories and American workers are making a greater volume of stuff than ever — high-tech, high-value products that are competitive in markets around the world. In the last 20 years, which include enactment of the North American Free Trade Agreement and China’s entry into the World Trade Organization, real, inflation-adjusted U.S. manufacturing output has increased by almost 40%. Annual value added by U.S. factories has reached a record $2.4 trillion.
What has changed in recent decades is what our factories produce. Americans today make fewer shirts, shoes, toys and tables than we did 30 years ago. Instead, America’s 21st century manufacturing sector is dominated by petroleum refining, pharmaceuticals, plastics, fabricated metals, machinery, computers and other electronics, motor vehicles and other transportation equipment, and aircraft and aerospace equipment.
The basic problem with real value-added is that it is not actually even attempting to measure the value that Americans manufacture. Rather it is trying to measure the value credited to the manufacturing sector. Confused? So was I as I worked through it. Even in my original article I did not explain this well.
The key is that when the BEA produces a statistic about the “manufacturing sector” this is referring to an internal way in which they have divided up all the establishments in the economy into exactly one sector. This is not how we commonly think about the economy. When we read “healthcare is 17% of GDP” this is usually cited using final expenditures, which implicitly measures both the employment of doctors and nurses but also the resources expended in constructing hospitals, manufacturing medical devices, subscribing to medical records software, etc.
But when it comes to the “manufacturing sector” the BEA’s number actually excludes the construction of factories, the ERP software, the engineering offices at a different address doing process design, the third-party janitorial service cleaning the factory, the power station next door powering the factory operations, etc. This is because the number comes from their GDP-by-industry tables, and everything must be in exactly one industry, or the numbers won’t add up to equal overall GDP. The entire purpose of the “real value-added” number is to be internally consistent – not to be a useful measure of what America manufactures.
What Americans actually want to know is the value of the stuff actually manufactured in America. What we want is a number that represents the inflation and quality adjusted sales value of the stuff, minus double counting of parts shipped from one factory to another, minus the inputs from imported components that are embedded in American products.
The pundits who cite real value-added imply that this is what it measures – inflation and quality adjusted (real) gross output minus real inputs, to them, means the value of stuff America makes minus the double counting and imported products.
But this is not the case!
While “real value-added” partially measures this, it is also a measure of what specifically gets credited to the establishments labeled as “manufacturing establishments.”
When a factory fires its third-party catering service, “real value-added” goes up, even when there has been no improvement in any sense to American manufacturing.
When a factory uses less energy to make the same quantity and value of products, real value-added goes up. But if a new cheap source of power comes online, and without hiring any more employees the factory simply turns up the energy usage and doubles production, America would be making more stuff and more value, but manufacturing sector value-added would actually be flat.
Even pundits who perhaps understand that energy and the engineering department and janitorial services are part of the “inputs” being subtracted, probably have never worked through the implications this has for quoting percentage changes. The artificial choice to make every establishment only belong to one sector makes the manufacturing sector an artificially small denominator, so when you have a change in real gross output the percentage change to real value-added gets amplified.
When a factory makes some design improvement that requires no new input costs, and that improvement improves the factory quality or quantity by 10%, real value-added can go up 10% … or 40% or 100%...Of that, say 40%, 10 percentage points are from making more, the other 30 points represent the manufacturing sector increasing its share of credit for the final product at the expense of other sectors of the American economy.
Conversely, a 100% improvement in real value-added does not mean that America had some combination of making more, making better, or making more of the value-chain that added up to 100%. It could be merely 10% or 20% or negative 10%.
To see the math on this, imagine there is $100 in product being made with $75 in inputs (energy, raw materials, software subscriptions, cleaning services, marketing agency spend, engineering department spend, etc.). Value-added is $25. Let’s say the entire value chain is domestic. A research institute somewhere publishes a scientific breakthrough, the engineering office adapts the breakthrough to a revised machine design, the factory floor implements the design change and the factory now makes 10% more product without using any more materials or energy or other inputs. Now the factory ships $110 in product for the same $75 in inputs. Which means value-added is now $35, it is up 40% (slightly less than that using BEA’s preferred Fisher index). And when you factor in the problem of double deflation, it actually can be much more than 40%, but that gets very technical and I’m going to save that for later on. Thus America manufacturing 10% more product results in 40% more “manufacturing value-added.”
This is not just a theoretical problem. Since improvements in manufacturing value have largely taken the form of improved design, such as fitting more transistors on chip, without a proportional increase of inputs, this is a real problem that totally makes a hash of the data.
“Real value-added” is substantially a measure of the efficiency at which the establishments labeled “manufacturing” turn energy, materials, their ERP software, their marketing spend, their janitorial services, their engineering department, etc, into final products. It is, frankly, in my opinion, not just useless for measuring “what Americans manufacture” but it is mixing so many things together it is just useless overall. (The statistical agencies cannot actually determine if a particular new valuable feature on a car was more due to the people on the factory floor or the folks in the software department, as I understand it, credit is arbitrarily assigned in some way such as by using payroll data).
Even if you believe it is useful for the “GDP contributions to growth table” as Brent Moulton uses it, it is simply not a usable number in the context of debates about the value of what Americans manufacture. You cannot leap from “real value-added is up” to “this proves America is a manufacturing powerhouse, stop worrying about offshoring.”
If you take my example above, and then think about a two firm economy, the problem becomes more obvious. Say we have two firms, both making $100 in product with $75 in inputs. Firm one actually has a fall off in production, now making $80 on $60 in inputs. Firm two made some design tweaks, now making $110 on $75 on inputs. Whether this is an increase in quality or quantity does not matter. So overall, the economy is making 5% less. Manufacturing in any common sense measure is down, the economy has slightly deindustrialized. But real value added is now $190 - $135 = $55, which is up 10%! Thus real value-added is up, even as the actual “value America manufactures” is down!
None of my main critics actually disputed that this is how real value-added works. They simply didn’t see this as a problem!
A lot of replies to my original article were of the form: “You accused American government bureaucrats of maliciously twisting the numbers, but then you explain how they did everything in accordance with the international standards of how the economics community defines value-added.”
My response is: American bureaucrats are complicit along with the international economists community in creating a number that has no bearing on the real world questions people want answered, and then allowing the general public to believe that it meant something about American production of manufactured goods, while responding to any critiques with, well of course it is not perfect...but continue paying our salaries to sit in air conditioned offices and play with excel and we will continue to make tweaks, it is very important work we are doing.
I pressed Brent Moulton to explicitly denounce the use of “real value-added” for purposes of measuring the health of manufacturing or “what America manufactures.” He dodged:
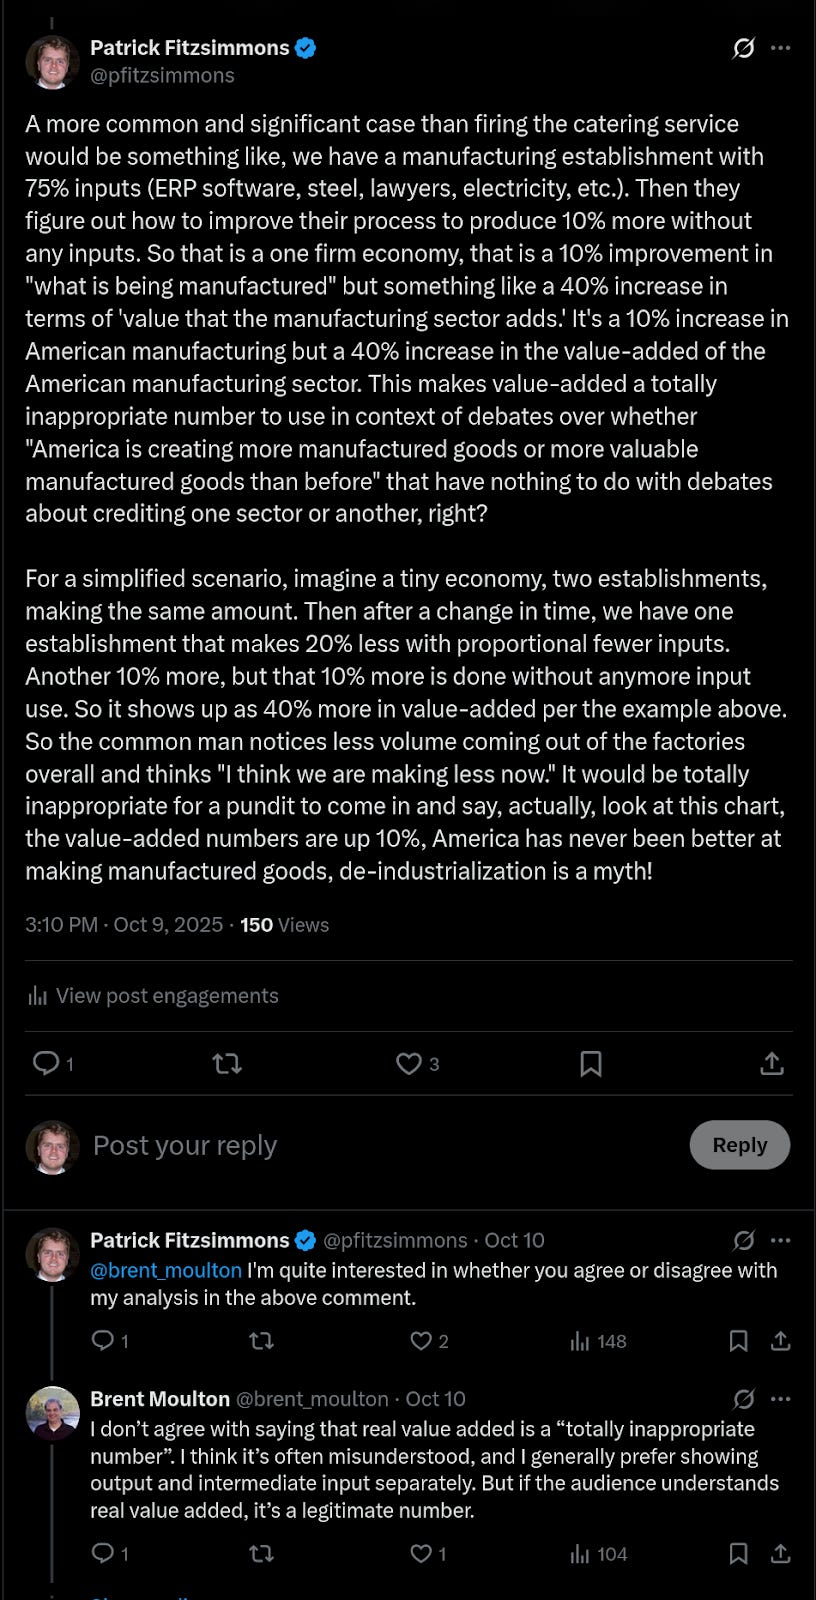
Notice the slipperiness here. I asked if it was inappropriate to use for the purpose of arguments about “what America manufactures” and he instead answers as if my question is “is it totally inappropriate number [for any purpose].” And then he says “But if the audience understands real value added, it’s a legitimate number.” Which is ludicrous! New York Times readers and Wikipedia readers do not understand this number, therefore it is inappropriate to use!
Amazingly, by confirming my analysis of real value-added, but then declining to make a clear statement against the pundits and journalists misusing it, he also confirmed my analysis that the statistical agencies were complicit in misleading the public.
I responded to him thusly:
You say “if the audience understands real value added, it’s a legitimate number.” But of course the audience does not understand! Therefore it is inappropriate to use! Look at how Wikipedia, NY Times, LA Times, AEI, are using real value-added and not explaining it to the audience (screenshots attached). They are using it in a context where the audience will assume it is a measure of “a record high value of American produced manufactured goods” and not a number substantially about divvying up credit among sectors of the American economy.
Doesn’t this bother you? Don’t you feel any moral duty to issue a straightforward and forceful correction? If not you, then who? Very few people understand how the number actually works. If the BEA or someone like you with the stature is not correcting them, they aren’t going to stop misusing the number and they aren’t going to stop misleading the public.
I urge you, or even better, the BEA, to issue a statement such as:
“It has come to my attention that pundits have been using the BEA’s ‘real value added - manufacturing’ data inappropriately to make arguments about the change in the value Americans manufacture. That is not what the number was designed to measure. It is a highly technical and easily misunderstood number that is substantially used to give credit among sectors of the U.S. economy for production, and so for instance, it can be down when actual production, or the value of the production, is up, or up when production is down, if credit for contributions has shifted between the manufacturing establishments versus power generation versus engineering sector. The BEA does not currently produce a number designed to measure the change over time in the value of American manufactured goods production. Such arguments must be made by looking at a combination of numbers, including real gross output, data about imports of components, industry data, etc.”
If you issue such a statement, we can use it as a reputable source to get Wikipedia fixed and to get journalists to stop misusing the number. I think that is very important and I hope you do too.”
We hope that Brent Moulton and the BEA do the right thing.
Part 2: Assorted Responses to Critics
Brent Moulton, the former head of the GDP calculation at the BEA, began his criticism with “This article new article on GDP has a lot of problems. It seems to me the author first misunderstood a chart…” and then he says, “This is the chart that the author misinterprets. It shows real value added of manufacturing increasing, even though (as we’ve already seen), nominal value added is decreasing….The post by Palladium magazine describes the chart as showing “output” has “never been higher”, suggesting confusion of value added with output.”
But in my article the output “never been higher” statement is clearly referring to how Wikipedia and others are describing the number; it is the view my article is debunking! I label the chart very clearly as “real value-added” and I never confuse this in the article. The only time in the article real value-added is called output is when I am quoting a 1970s economist Thomas K. Rymes because I guess “net output” has been used as an alternative term for value-added.
Brent Moulton, then, right after saying I misinterpreted the chart, says, “To be fair, in the article the author doesn’t confuse output with value added.”
So in the tweet with 37,000 views I misread a chart, but in the tweet with 697 views I didn’t confuse anything. Great. Thanks.
He continues the tweet:
But he says the “real value added” series is “totally broken”, which suggests he thinks it’s not measuring what it should. But it measures what it’s defined as: output – intermediate input.
That means, for example, if real output increases while real intermediate inputs stay the same, real value added will increase by a larger percentage than output (since the percentage is taken with respect to a smaller denominator). That just follows from the definition.
Now, I do think most people citing real value added really should be using real output instead. Value added is a net concept, and it’s generally clearer to show what’s happened to real output and real intermediate inputs separately, rather than to their net value.
The tautological definition is irrelevant to the core point about how these numbers are being advertised and used. The BEA’s learning center page on GDP says:
The value of the final goods and services produced in the United States is the gross domestic product. The percentage that GDP grew (or shrank) from one period to another is an important way for Americans to gauge how their economy is doing….What can you do with GDP numbers? Answer questions like: Which industries are growing? Which are slowing?…
GDP by Industry
Produced quarterly and annually, these statistics measure each industry’s performance and its contributions to the overall economy, also known as its “value added.
The page is clearly communicating to the public that value added is a measure of “growth” and “performance” and that percentage changes can be understood by the public. Thus it is no surprise that that is how pundits use it.
And, thus it is “broken” if it is does not do that. Or at the least, the BEA web site needs to be changed to communicate exactly what the public can use value added for.
And, at no point in our very long back-and-forth does Brent actually endorse the value-added for the purposes of general (non-expert) public use or as a measure of growth. When I asked him if real value-added could be accurately described as a measure of the growth of manufacturing he replied: “The term ‘growth of manufacturing’ is unclear, so I’d recommend avoiding it.” Later he added “it’s often misunderstood.” Brent Moulton never disputes my analysis that real value-added can be up 10% even when the amount/quality/value of what America manufactures is down 10%. He essentially corroborates my analysis, up to the point where I say, “Ok, so then the BEA should update the learning center” or “Ok, so then please make a clear statement to tell the pundits to stop using the number in that way.” At that point he falls back on “it’s valid measure of what it’s trying to measure” ignoring my entire critique that it’s not valid for the particular purposes that pundits and the BEA are ascribing to it.
Continuing with Brent Moulton’s critique:
The title of the article is “How GDP Hides Industrial Decline.” But as Ernie Tedeschi observes, the GDP-by-industry data do not, in fact, hide the decline in manufacturing. It’s clearly seen in the nominal data.
Utterly irrelevant. Neither the BEA nor anyone else is claiming that the “nominal” data is the real (in the technical or colloquial sense) measure of American manufacturing. The claim is always some variant of, “sure relative to other sectors manufacturing is a lower share, but never fear Americans, the actual measure of manufacturing, in real value-added, America manufactures more than ever.”
Moving on, in a low move, Brent Moulton blatantly ignored my actual words to knock-down an argument I did not make:
He’s concerned that the number of motor vehicles produced was down 11%, but real output was up 39%. Is the US is now manufacturing higher-end vehicles? …Semiconductors is a clearer case …Steel is a similar story.
No, I understood that real output up 39% in motor vehicles reflected quality improvements and a shift to making SUVs. My concern was the difference between the 39% real gross output and the 125% increase in real value-added which does not reflect better cars and does not plausibly reflect America making more of the parts of cars. It does not reflect an increase in the “growth” or “performance” of America’s production of automobiles. Same with semiconductors — faster processors is taken into account in real gross output up 262%, it doesn’t explain the real value-added numbers. Same with steel, better steel is taken into account in the real gross output being up 5%. The question is does the 125% jump in real value-added represent a meaningful increase in the “growth” of American steel production?
These tweets of his are especially galling because he literally includes a screen-cap of my article where I state very clearly that I’m trying to explain the 125% increase in “real value-added.” He just flatly ignored what I actually said and made a take-down of an argument I was not making. I could understand how a non-technical reader could be confused and not realize that the distinctions here, but Brent Moulton very clearly knows that the quality adjustments happen at the “real gross output” step, not the “real value-added” step.
Now we move on to the discussion of quality adjustments. Brent Moulton writes:
There are lots of other problems with the article, but I’d like to focus on the accusation that the quality adjustments used by BEA and BLS are “fake” and “not objective”.
I said “fake objectivity.” See part 3 of this article for how they want to adjust for car longevity, but they cannot actually do it, so instead they include a smattering of other adjustments all numeric and cost based (therefore appearing to be objective) but not actually measuring how much longer the typical car lasts.
I would actually prefer true subjectivity (eg, actually surveying mechanics to see how much longer cars last) than fake objectivity.
I would prefer honesty about subjectivity – give me toggles to show the cars with adjustments for comfort and convenience features and without – rather than pretending that there is a single right number. Publish GDP with error bars based on different adjustments and assumptions rather than feed the myth that there is one true number.
Brent Moulton continues:
New adjustment methods undergo testing and review by methodology committees and by management before they are adopted. Often, research was presented at meetings such as NBER or academic advisory committees (which were sadly discontinued this year).
The fact that a committee designed the number is completely orthogonal to the question of whether it is objective. And in fact, testing proposed methods to see what the results are, and then having layers of committees and management review the results before approving using the method is exactly how you get a situation where, as I said, “consensus feeling” drives what the resulting data will be, instead of vice versa. To avoid even accidentally choosing methodology to match subjective feelings about what the result should be, one would either need to 1) rigorously test results against some other yardstick (eg, credit scores are a complicated statistic but can be tested for predictive power against actual future defaults) or 2) approve or reject the method while being blind to what the impact on the data would be. Now 1) is not feasible with the benchmark GDP numbers (there is no higher yardstick) and 2) may not be possible either. That is OK. It is OK to make a statistic that tries to turn on-the-ground observations into a number. Many fun sports statistics do this. You just have to be honest about it and not make grandiose claims about how it is one of the great inventions of the 20th century.
I do owe one point of clarification: selecting adjustments to produce a result that feels right according to consensus is more of a problem with the headline, expenditures approach to real GDP. I had a lot more to say on this, but it was cut and moved to a future article, so stay tuned! The primary problem with real value-added is that it was designed based on internal needs for consistency, so it ends up being broken for the purpose of answering real world questions.
Then on the openness question:
And methodologies are communicated to users in extensive methodology handbooks, articles in the Survey of Current Business (BEA) or Monthly Labor Review (BLS), and FAQs.
In 2025, I have high standards for openness. We have github now. All the code for calculating all the price indexes and GDP can and should be in a public github repository. All the discussions about which methods to adopt can happen in the open in pull request threads. Imagine, Linux were to close off all its source and replace it with 1,000 pages of documentation. Would you still consider Linux to be “open” just because of the verbosity of documentation?
Time and time again while studying GDP numbers I’d hit roadblocks where there is simply no way to figure out what is really going into a number. For instance, when a $50,000 car comes out of a factory, the entire exercise of how the statistical agencies decide to assign credit for the value of that car between the factory, the engineering office, the marketing team, corporate headquarters, etc, is impossible to double-check or verify. Or for another example, I hit roadblocks finding how the quality adjustments for a car’s new electronic technology matched to quality adjustments in the chips and sensors that go into the car; or quality adjustments to microchips matched with quality adjustments to the lithography machines imported from the Netherlands that make the chips. Now there are legal privacy reasons that prevent this information from being made public. OK. But that still means I am right that these numbers are made behind closed doors!
Brent pushed back on my saying GDP numbers could not be replicated:
Sophisticated users (Atlanta Fed, some private forecasters) can come pretty close to replicating BEA methods.
I asked Brent: “Can the Atlanta Fed or anyone else replicate GDP real value-added calculations back to 1997 including the $1.2 trillion row for error adjustment (”not allocated by industry”)? Can they replicate the 1698% growth in real value-added semiconductors since 1997? Of the statistics cited in my article, how many can they replicate? Can they replicate a single one?” He did not respond yet, but the answer is of course no.
With a fully open and replicable statistic, if you see a number that looks very surprising you can dig into the calculation see “oh, yeah, this is an instance where it is clearly a result of methodological limitations” or maybe you see, “oh, I actually missed that something real happened in the world, this factory opened and America started producing a lot more of this thing, I have learned something.” But with a closed statistic, like GDP, there is no way to do that.
Brent linked to the BEA-BLS industry-level production accounts, but I had already been pointed to these by the BEA and they were almost totally inadequate for answering these questions.
Brent Moulton sums up his thread by saying
The accusation that GDP is “a number cooked up by government bureaucrats behind closed doors to match their subjective vibes of how the economy is doing” is simply wrong.
The American football statistics web site “Pro Football Reference” cooked up an interesting statistic called “Approximate Value.” Similar to GDP, it tries to condense all available data into a single number. In this case, they assign every football player since 1960 a singular value that is trying to best match how an expert actually watching the games would feel about the player. Unlike GDP, it is fully open and documented, I could run the equation at home. Like with GDP, the data is imperfect, many things cannot be quantified, and so they have to make a lot of workarounds, inferences, and arbitrary crediting of value. Unlike with GDP, they put a disclaimer about how the number should be used right at the top of their page:
AV is not meant to be a be-all end-all metric. Football stat lines just do not come close to capturing all the contributions of a player the way they do in baseball and basketball. If one player is a 16 and another is a 14, we can’t be very confident that the 16AV player actually had a better season than the 14AV player. But I am pretty confident that the collection of all players with 16AV played better, as an entire group, than the collection of all players with 14AV.
That is an honest way to describe a complicated and imperfect statistic. Let’s try with GDP:
GDP is not meant to be a be-all end-all metric. The human economy is far to complex for that, and the data quality not nearly good enough, this is not like baseball, we cannot create a statics like WAR. If a country has a 20% higher GDP than another country, we cannot be very confident that the 20% higher country is more “productive” in any commonly understood sense. If the GDP of a country grows by 3% of GDP, we cannot be confident that that country actually grew by 3%, or even grew at all. But, we are pretty confident that the collection of countries with 30,000 GDP have more productive capacity than the countries with 20,000 GDP. And we are pretty confident that across large sample size of uncorrelated circumstances, the collection of countries with a 5% real GDP growth are increasing their productive capacity at a greater rate than the countries with a 1% growth rate.
That is how GDP should honestly be described. The BEA should put this kind of qualification at the top of their learning center.
Moving on to other critics…
Ian Wyatt, formerly lead forecaster at the BLS got 12k view for his tweet:
If you’re going to criticize GDP, you might have more credibility if you had a photo of the right agency. BLS is part of the Department of Labor. GDP is calculated by BEA which is part of the Department of Commerce.
Unfortunately, my reply only got 255 views:
You know that the BLS price indexes are what turn dollar aggregates into quantities and make GDP “real”? Data, calculations, and methodological decisions from the BLS are an absolutely essential part of the final GDP number that the BEA publishes. Anyways, my editors say they chose the photo because BLS has a cooler building and you should actually read my article.

There was another critic who noticed that my statement that American ships cost ten times more was not backed by my source, which says they cost six to eight times more. He’s right, there was no need to round up an already damning figure. In the interests of accuracy and balance, I will ask the Palladium editorial team to correct the figure.
Karol Karpinski criticizes a line from my article about how GDP treats administrators as more productive than teachers. This is actually true, and I can and will defend it. However, this line was not about the value-added method of calculating in GDP, it slipped in from a critique of the expenditures method which got cut from the article. I will also ask the Palladium editorial team to correct this line which is misleading in its current context but stay tuned, I will be explaining in a future article how this is actually the case when real GDP is calculated using the expenditures method. Believe me, we are barely getting started with all the ways GDP calculation can go wrong!
Baron Douro tweets:
But lets not do “Soviet tractor production” statistics. Using steel is not itself a good thing. Better lighter cars that use less steel is a good thing.
More on this in Part 3, but we need all the statistics. Raw numbers, numbers adjusted for quality making different assumptions, numbers of cars, numbers of total horse-power years, global market share, market share by product tier, production statistics weighted by consumer surplus, not by sales price, etc. etc.
Goodhart’s law is a never-ending problem. Dumping some subsidy on a firm and saying, “OK, here is a few billion dollars, now increase battery production by 50%” would be very stupid because that would likely create the Soviet problem of very bad products. The art of statesmanship is to keep a goal in mind, but to act more as a gardener, and to try to grow a healthy, globally competitive manufacturing ecosystem that is producing the important high technology goods.
Part 3: Response to Mr. Fractally Wrong
Another critic, whom we will affectionately call “Mr. Fractally Wrong,” wrote a very lengthy and angry rebuttal to my piece. Despite being heavily boosted by big-name accounts on X, this is not a good rebuttal, and I am both surprised and dismayed to see so many supposedly economically literate, expert pundits lend their weight to such a weak article that seems to go out of its way to try and discredit me personally with invective, rather than wrestle with the points I actually raised. There are “chatgpt” references in embedded in his links he used, and the whole thing feels very LLMish. He presents a great wall of text with lots of smart-sounding references and even some mathematical notation, but again and again makes basic mistakes and lacks actual comprehension of what I was writing. It’s like he just found the first source that appeared to rebut me, dressed it up in vitriol and threw it at me, without actually bothering to verify it or think about what it meant for my underlying point. Unfortunately, these days, with the assistance of an LLM a person can generate 7,000 words in a weekend. My original article was the result of months of work carefully going through sources, working through models, and emailing back and forth with the BLS and BEA. It takes a lot longer to do high quality work, even this response has taken much time. Over three weeks, in fact. Here it is! My rebuttal, point for point:
On Inventing fictitious problems with real value-added output
Mr. Fractally Wrong writes:
…First, notice that there is no actual argument being made here; instead, Fitzsimmons is simply quoting industry-level statistics and claiming that they are “bizarre” or “implausible.” In general, if someone quotes a series of economic statistics from the same bureau and claims that they are inconsistent, what is the most likely explanation: that they are in fact inconsistent in some novel way, or that the speaker is simply mistaken?
We are already off to a bad start. Mr. Fractally Wrong seems to have misunderstood my entire point, but that has not stopped him from vehemently arguing against his own misunderstanding. My point was not that the BEA was calculating real value-added incorrectly according to how real value-added is defined. My point was that real value-added was producing absurd results if its goal was to be a measure of the value of the production of U.S. manufactured goods, which is how everyone from the Wall St Journal to the New York Times to Wikipedia is actually using the number in the real world (if you skipped Part 1 and 2, see above). And as I related above, not even the people at BEA now, or who were in charge of this number in the past (Brent Moulton, Doug Meade) recommend the use of this number for this purpose.
In fact, despite his nickname, Mr. Fractally Wrong confirms all my analysis, agreeing that a small change in the amount or the quality of things America makes can actually result in an unpredictably bigger change in value-added, even when there was no change in the foreign components in the product.
He confirms that real value-added is mixing a whole bunch of things into it, like giving credit for resource efficiency, that are not what people think of when they are seeing the figure cited in arguments about deindustrialization or how much America makes.
He wrote twenty-six paragraphs and there is really not anything that requires response because all of it is simply misunderstanding my thesis.
I do want to address a few points though, where he accuses me of making factual errors or sleights-of-hand:
Hypothetically, if you went from manufacturing only 1995 Camrys to only Teslas with the same input, it seems entirely possible that you could have an 11% decline in number of units produced yet plausibly claim that real value-added output has increased by 125%, because Teslas are obviously vastly superior to 1995 Camrys
No, these quality improvements are already taken into account in the real gross output figure which is up 39%. They cannot explain the real value-added being up 125%.
Similarly, Moore’s Law famously observes that the number of transistors on an integrated circuit doubles every two years; is it so implausible that over a period of multiple years, value-added output for semiconductors has enormously outpaced growth in the number of actual CPUs produced?
Again, these adjustments for processing speed are made real gross output figure which is up 262%. There is no additional quality adjustment on the real value-added number, so increase in processing power cannot explain why real value-added is up 1698%. Here at least, part of the reason may be that more of the value production is on-shore, but that change doesn’t possibly seem big enough to explain all 1698%.
Or, alternatively, I could claim that steel mills have shifted to manufacturing more AHSS/ULSAB grades or electrical steel, which have a higher unit value for the same tonnage.
No, again, this would already be included in the real gross output data, which was only up 5%. Nor was my narrative pure speculation, it was an educated guess based on reading news articles and looking at the detailed industry-level production account tables.
He continues:
In fact, all of the hypotheses that I’ve supplied are more plausible than Fitzsimmons’s narrative, because, crucially, he misses that the BEA actually differentiates scrap metal as an input from raw iron ore. For example, the 2002 BEA Data Analysis for the Development of the Experimental PPI Aggregation System explicitly breaks out S00401 “Scrap” and S00402 “Used and secondhand goods” as separate commodities, and commodities are rows in the BLS Use Table, which is where scrap shows up as an intermediate input to steelmaking.
Again, he misses my argument. I fully expected the BLS would be tracking scrap metal in its own price index. My point was that the value-added increase for steel reflects a reduced use of energy inputs. But the real value added calculations cannot account for the fact that when you use scrap steel as an input there is energy embedded in the material, in a way that it is not for raw iron ore. At any rate, this point is not really key to my overall argument.
He continues:
It is in fact true that U.S. steelmaking has progressively shifted to using scrap rather than ore as an input due to a shift toward electric-arc furnaces (EAFs), but this is in fact consistent with an increase in real value-added, because EAFs use less energy per ton of output and a different input mix in general, plausibly leading to a significant reduction in real inputs.
For all his criticisms, it turns out we are in agreement! The increase in value-added for steel is most likely due to an increase in energy efficiency, which bolsters my point. The real value-added number is used to make arguments about the value of what America is manufacturing. So when we find that mixed into the statistic is data about energy efficiency, and thus the number is going up not because America makes more or better, but because of using less energy, then the number becomes completely unusable. Energy efficiency should be tracked in its own, completely separate number.
Mr. Fractally Wrong also wrongly accuses me of a sleight-of-hand:
making it very unusual that Fitzsimmons would claim that “our economists [should] adjust the 2017 figure to be $110 billion in ‘real’ terms and show a small 10% increase, right?” In neither scenario is the increase in real output anything aside from 10% to begin with! This reveals the clever sleight-of-hand being made here, where Fitzsimmons semantically confuses change in real output with change in value-added output.
The “show a small 10% increase, right?” was referring to how someone applying common-sense would think the number would work, if the number was measuring changes in the value of U.S. manufactured goods.
Perhaps the original article could have been more bullet proof against malicious interpretations. My verbiage actually got simplified during the editing process to make it more readable, but even so I would think the point would be accessible to a charitable, intelligent reader. A more clear version would read:
The intelligent person who is naive about how these calculations work might think: ok, the entire car got 10% better, thus 10% more value coming out of America’s factories, and there was no increased portion of the car being made in America, so that number called “value-added” is probably up 10% as well. Conversely, the intelligent person might think if there is a number “value-added” that is up 40% that means either the quality of the car got 40% better, or there were 40% more cars made, or America vertically integrated so that 40% more of the car components were made in America.
Mr. Fractally Wrong continues to completely vindicate my analysis:
Let’s say that you make apple juice from apples, and an apple costs $99, and you sell the apple juice for $100. Now let’s say that you figure out how to magically make the apple juice tastier, so that you can charge $101 in the market. There is no contradiction between the assertion that your apple juice has increased 1% in quality (from $100 to $101), and that the amount of value you’ve added to the raw apples has increased by 100% (from $1 to $2). In fact, it is not mathematically possible for the percent increase in real value-added to be less than the percent increase in total output when the input cost is held constant!
Exactly! Maybe I have to withdraw the nickname Mr. Fractally Wrong. But he is totally missing the implications of this: if someone were to bring that “100%” increase into an argument about how much American apple juice production has grown, or how much better our apple juice was, they would be grossly misleading the American public about apple juice production!
Mr. Fractally Wrong also responds to my analysis about how the choice of base year impacts things, “it should be intuitive that it shouldn’t really matter whether you perform a quality adjustment to the base year or to the current year,” but my comment about base years was in reference to double deflation where it actually does matter, which he later picks on: “It’s true that in the limit as k→inf, adjusting output at t1 results in value added at t1 going negative.” It is interesting to me how Mr. Fractally Wrong is full of rhetoric to attack me, but to confirm my points he reverts to dryly stating mathematical relationships without noting they support the very argument he is supposedly critiquing.
And again, Mr. Fractally Wrong confirms my analysis. He confirms that real value-added can make numbers go negative, and he brings up old academic literature. However, since nobody has found a better way to do the calculation, he just doesn’t see this as a problem!
To which, the best response is:

Mr. Fractally Wrong continues:
This has been known since 1962, it appears to be a relatively rare issue, and double deflation is still the accepted standard calculation method for real value added. Also, regardless of whether or not the deflators used occasionally lead to negative real value added, we should still be able to look at the change in real value added over time.
But the number does not actually need to go all the way to negative to be a huge problem. As the prior year value-added gets compressed smaller the change in real value hits an inflection point and thus becomes a meaningless number!
There is one technical point which my original article glossed over: the BEA actually uses a Fisher index which essentially will adjust the quality adjustment going backwards, and then do it the other way going forward toward the base year, and then average the two numbers. But just including the retroactive adjustment as half of the average is enough to make a mess of the numbers. In his tweet storm, Mr. Fractally Wrong abuses quotation marks by having me say something I never said, “Next, Fitzsimmons complains that quality adjustments “should” be performed to the output year and not the input year. “ I never said anything about “should”, I was giving an analysis of how it actually works in the particular scenario. In other scenarios, choosing the past year as the base year creates nonsense numbers. Fisher indexes, which average the two, do not solve this, I might write more on this in a future article. The problem is fundamentally intractable.
At root, Mr. Fractally Wrong does not seem to have a problem with numbers that fail to map back to the physical world in any sort of predictable or understandable way, as long as those numbers are calculated according to the rules of how the number is supposed to be calculated. But when the entire purpose of the number is to communicate with the public about what is going on in the world, that is a fatal problem. It seems like we are at an impasse on the basic philosophy of what numbers are even for.
In emails, with the experts at the BEA, they actually sent me a spreadsheet which demonstrates the math of how a small change in quality can result in a huge change in real value-added. The example in the sheet is a situation where inputs are 90% of production and a 10% change in quality results in a 349% increase in real value-added. But a more realistic scenario might be when inputs are 75% of output (as in cars or steel), and a 20% change results in a 132% change to real-value added. As we go up, a 33% change results in a 1,656% increase in real value added, and a 35% change results in finding the square root of a negative number, literally an imaginary result.
But is this kind of thing likely to be a problem in practice? This effect happens when quality adjustments retroactively push real gross output so far down that real value-added becomes a tiny sliver compared to the inputs. And this is what we see with the subcategories under “Computer and electronic products”, which, IIRC, account for something like 60% of the real value added growth. With the “computer and peripheral equipment” row, quality adjustments squish a nominal value added of $34 billion in 1997 dollars, down to a mere $333 million in “real” terms (It’s remarkable that it’s not actually negative) on $41 billion in “real inputs.” When the original value-added is squished so low, the percentage changes become insanely high. So we have real gross output improve 216% (which, remember, already has the hedonic adjustments for faster processors built into it) turn into an 9,219% change in real value-added. This is exactly the effect theoretically shown in the spreadsheets, and that Doug Meade, formerly in charge of the Value-added number at the BEA, made him warn against using the number. (Which he confirmed to me over email).
Mr. Fractally Wrong concludes:
However, at the end of the day, it’s not like value-added is an incoherent concept in and of itself, and it’s clear that over that half-century of debate, economists haven’t really come up with methods superior to double deflation of inputs and outputs. Instead of proposing an alternative,
It’s not that it is incoherent, it’s that it’s designed for internal consistency within a larger statistical construct, rather than being useful to real world arguments about the volume and value of what Americans manufacture.
The best methodology that I can think of would be to take the inflation adjusted sales data to products shipped out of the manufacturing sector (similar to BLS’s Real Sectoral Output index) and then subtract out the foreign manufactured goods included. It would be very tricky to correctly assess the value of the foreign goods, especially for years passed and with consistent quality adjustments. It might make sense to exclude categories that are basically just packaged agricultural or resource goods. Double deflation would still be a problem. I would advise against publishing only a single number, rather publish a range based on making different methodological assumptions. The resulting statistic would not be a number consistent with the other GDP numbers. But it would be a statistic that was at least trying to answer the questions we want answers to: what is the health of the manufacturing ecosystem in the United States? What is the quantity and quality of what the U.S. manufactures? And even with this methodology, I’m not sure an aggregate would be giving substantial usefulness to the public and to policy-makers versus looking into comprehensive data category-by-category. Disclaimers should still be applied to the number just as I advised earlier in this article when comparing GDP to “Approximate Value.”
On Nominal Value-Added Comparisons Between Countries
Mr. Fractally Wrong correctly summarizes my argument about the problem of using nominal manufacturing value-added to compare U.S. versus Chinese production:
In the next section, “The Gloomy Reality of U.S. Manufacturing Output,” Fitzsimmons argues as follows:
Some commentators use nominal, rather than real, manufacturing value-added to demonstrate that the U.S. is not lagging behind other countries.
However, prices for equivalent goods vary between countries.
Therefore, this argument is invalid.
There is nothing wrong with this argument per se. If an American car costs $20,000 and a Chinese car costs $10,000, and the two cars are functionally identical, then it would be correct to say that $1 million of American car manufacturing output is equivalent to merely $500,000 of Chinese car manufacturing output. However, the basic issue here is that Fitzsimmons fails to actually check his theoretical arguments against empirical data. Fitzsimmons supplies a number of concrete examples…
True ignorance is better than false knowledge. Using unadjusted nominal value-added is wrong and will give false knowledge. The people citing that number to advertise knowledge must stop. We don’t have better numbers though. I chose some examples where I could find them to indicate the possible problem. But consider my article an exhortation to stop boasting about the existing numbers; realize that we are flying blind, and the real numbers may be 4 to 8 times worse.
Mr. Fractally Wrong rejects my scattershot examples and decides to adjust the numbers by the “Purchasing Power Parity” (PPP) indicator. With this adjustment, instead of China being 62% ahead of the United States, they are around 200% (3 times) ahead. That is vindicating my entire point!
Even by his own logic, Mr. Fractally Wrong should at least change his criticism of me from “fractally wrong” to “directionally correct”!
But, adjusting for PPP is a ridiculous thing to do when we are trying to compare manufacturing output. Purchasing power parity is based on a sampling of the goods being sold in a country, regardless of where those goods were produced, which is not at all what we want. In PPP, the American price level is adjusted downwards (and thus GDP adjusted upwards) for cheap Chinese laptops on the shelves of American stores, and Chinese prices reflect expensive Saudi gasoline being pumped out of the Chinese gas stations.
In his final chart he supposedly adjusted for “production PPP.” But looking at his linked source, I cannot find where he found “production PPP.” It seems he has misread a statistic for the price-level of GDP calculated using the output approach (aka the value added or “by industry” approach) adjusted for the standard PPP. There is no indication that the PPP being used is “production PPP.”
If Mr. Fractally Wrong has found a source for a price index comparison that only samples only the prices of manufactured goods produced in that country, then that would be very interesting. But if so, he should link directly to the data and link to an explanation of the methodology.
But really, the difference in manufacturing between China and the United States is actually incalculable no matter how we adjust it. That is because the biggest cause for concern is differences in products where the United States is not even in the game, and so no cost parity can even be calculated.
Imagine we have two countries, Albion and Indus. Indus is a maker of fine, luxury garments. They are hand-crafted, personally designed, and they ship ten thousand garments around the world for $100 million a year. Albion makes durable jeans out of incredibly productive factories, and also lots of muskets. They ship 10 million jeans for $100 million a year and 10 million rifles for $100 million a year. The difference in value added is only 2 to 1.
But what is the difference in the actual potency of their manufacturing? Would a pundit from Indus be correct in saying, “Albion only outproduces 2-to-1, they aren’t that far ahead, we don’t have to freak out, our manufacturing is still strong”?
We would actually get a different, and more realistic comparison, if we calculated the difference not by the market price of the products produced by the mega-efficient producer in Albion, but what the products would have cost to manufacture in Indus. If those jeans and rifles would have cost $100 to make with far inferior Indus manufacturing technology, then the actual difference in manufacturing output would be 20-times, not 2-times.
On Per-capita manufacturing decline
Mr. Fractally Wrong spends seven paragraphs complaining about my “per-capita” manufacturing data and not being able to find it anywhere. But as I said, “It seems more reasonable to judge our standard of health as making stuff for the American population.” The “per-capita” adjustment was done by myself using U.S. overall population data. For someone evidently so assured of his own intelligence, I’m not sure why it was so very difficult for Mr. Fractally Wrong to find U.S. population data, or perhaps even realize the obvious that I had simply calculated the number myself. My baseline for “no manufacturing decline” is that manufacturing should have kept up with the growing U.S. population and its needs for refrigerators, laptops, cars, etc. So if overall “output” is up, but not up relative to population growth, I consider that to be decline.
I was not adjusting for “per manufacturing worker”, the productivity of the manufacturing worker was not the subject of my article, and is a whole other can of worms.
Mr. Fractally Wrong :
The second link given is to the FRED time series Manufacturing Sector: Real Sectoral Output for All Workers (OUTMS). On top of not being a per-capita statistic, OUTMS is only 5% below its 2007 peak and significantly higher, not lower, than its value in 1997.
Right, the original statistic is not per-capita, so when it is up 10% in raw terms since 1997, and the U.S. population has grown 23%, that means it is down relative to the population, which refutes all the articles about America manufacturing doing great and there being nothing to worry about. Is this the part now where I have to insert the vitriol about how dumb and bad-faith my interlocutor is?
On using real gross output to examine U.S. manufacturing health
Having discarded real value-added, my article goes on to discuss what we can learn from looking at the “real gross output” numbers. Mr. Fractally Wrong does not like this:
Criticizing value-added output because it’s not gross, then criticizing gross output because it’s not value-added
Another interesting rhetorical trick utilized in this article essentially decomposes as follows:
Real value-added output is a poor metric because it does not accurately capture changes in gross output.
Gross output is a poor metric because, on account of not separating out the value-added component, necessarily includes the value of inputs.
When presented in close succession, it’s self-evident that this is not a serious line of argumentation — you can’t simultaneously argue that value-added is bad because it’s not gross, and then also argue that gross is bad because it’s not value-added!
First, this is a malicious and inaccurate paraphrase. I am very much not “criticizing gross output because it’s not value-added.” I said it would be good to subtract out imported manufactured goods from real gross output, but real value-added is not a number that merely subtracts out imported manufactured components, that is just a small part of what it subtracts out. It’s easier to go from a simpler, flawed number and think about the needed adjustments, than to start from a far more complex, broken number, and opaque number, and work backwards.
Notably, the head of the GDP calculation at the BEA recommends the same approach that I took:

As I have argued, real value-added cannot be used at all for the question we care about. It is mixing in too many other things that we don’t care about – such as the efficiency at which factories turn ERP software into widgets – and has weird effects where the percentages don’t map to anything about the physical world.
Thus, the only thing we can do is to take the very flawed “real gross output” and then try to piece together whether it is an overestimate or underestimate based on what happened with the inputs. Specifically, the inputs we care about are the double counting of domestic manufactured goods, or the inclusion of imported manufacturing in final American products. The double counting of domestic manufactured goods is probably not a big issue, because the BLS sectoral output index actually does account for this, and its trajectory is almost identical to that of the BEA’s real gross output. It might also make sense to remove food products entirely — from the standpoint of manufacturing “power” or “growth” it’s not actually important if real gross output is down because people moved to eating less processed food and eating apples instead of applesauce. I did a quick check of this, and taking out food products doesn’t really change the numbers.
As for imported components, since there has been consistent news reporting over the years that American manufacturers have increasingly relied on foreign parts as part of their products, real gross output is likely an upper-bound on how U.S. manufacturing is doing. Now I could be wrong here – we need better data! Those news reports are not systematic and may be missing out on how U.S. manufacturing now focuses more on parts rather than final assembled goods. But my current educated guess is that change in real gross output is probably an upper-bound.
Notice that Fitzsimmons is supplying a perfect argument for taking into account the change in value accruing to the domestic manufacturing process, that is to say, the value-added output, which Fitzsimmons merely several paragraphs earlier characterized as “a fictitious measure […] with no meaning!”
Yes, the real value-added number that we actually have is a fictitious number with no meaning. It would be interesting if we had a manufacturing statistic that only subtracted out double-counting and imported manufactured products as included in the products, but that is not the number the BEA produces, that is not what “real value-added” is and so it is useless!
Even worse, however, is that Fitzsimmons misses that the Industrial Production: Manufacturing index, IPMAN, is constructed by aggregating data from different industries with value-added weights, so that industries with low value added contribute less to the total.
The IPMAN is so poorly documented that it is impossible to tell to what extent it has all the same flaws of the BEA real value-added numbers.
On Quality Adjustments in Real Gross Output
Mr. Fractally Wrong continues:
First, Fitzsimmons argues that including quality adjustments in headline numbers misleads the public…It is not immediately clear why misconceptions held by the public are relevant to the discussion at hand, in the same way that an economic analysis of tariffs is not contingent on whether or not the typical American understands that tariffs are a form of taxation.
It is entirely relevant to an article informing the public about what these numbers actually mean! It’s incredibly relevant if major publications seem to think that “real gross output” is the number that measures “more” and that “real value-added” measures “better.” This is not the case – “real gross output” is a very flawed measure of “more and better”, “real value added” is useless for measuring “what America manufactures.” When Pew Research was scolding the public for not realizing that manufacturing real gross output was up, did Pew inform the public that these statistics were treating making a ten times faster processor as making ten processors instead of one? Did the Pew Researchers themselves know that?
And it is the fault of the BEA and the national accounts community for naming the statistic in a way that makes it seem like a count, and then failing to correct public misuse of the number. I highly recommend the BEA fix the title of the number. Change the label to “Real (ie. Price and Quality-Adjusted) Output.” Or name it “Manufacturing Establishment Sales Receipts and Imputations with Inflation, Quality, and other Adjustments” The BEA can and should have a public title that is for use by pundits and Wikipedia, and then a more discreet technical label which identifies the dataset in the terminology of the economics community. The technical label should come with a strong disclaimer that the technical label should not be used outside in front of audiences who don’t understand it. Only then, will this kind of confusion stop leaking into Wikipedia and the popular punditry.
On the Basic Validity of Quality Adjustments
My argument was that quality adjustments are subjective, and it is a bad idea to mix the subjective and objective because it destroys our understanding of the number. Better to use the numbers for the objective thing, and then actually have a discussion and understanding of the product for the subjective part. It particularly invokes my ire when people cite a number with subjective information embedded in it, as a knock-down argument against someone else’s subjective view of how they see the economy.
For example, my own opinion is that a 2025 Toyota Highlander Hybrid Platinum costing $60,000 is a much better car than a 2006 Lexus 470 that cost $67,000 new. The modern Highlander is safer, much better gas mileage, better 0 to 60, better infotainment and I don’t care if the Lexus maybe had better off-roading. I might say, hey, the CPI being up 31%, is actually an overstatement, CPI should actually be down, cars of equivalent or better quality are cheaper. But then a frugal family looking for a new reliable family minivan, might see that the 8-seater 2025 Honda Odyssey costs 32% more than the 2015 Odyssey over a period during which new vehicles CPI rose only 22% and the PPI only 16%, and they say, “I don’t care about lane departure assist, I just care about the 8-seater minivan that will get my kids to soccer practice not breaking my budget” and they would think that CPI was understating inflation. The increase in price and quality change inherently depends on the subject.
Mr. Fractally Wrong says that “market prices in capitalism” is the objective metric. But this doesn’t work because we do not have time machines that allow market exchange between the years 2015 and 2025, there is no market where the new 2015 Odyssey and the new 2025 Odyssey are both for sale, and none of the methods used by the statistical agencies (overlap, hedonics, or explicit) actually replicate market prices in capitalism.
Now – there is an interesting point that all measuring of counts require some sort of assessment of quality in order to know you are counting the same thing.
I think this is on a spectrum. If you have a straight measure of longevity, that would be one of the most objective adjustments possible, and I wouldn’t have a problem including it in the data. But once we include remote start and infotainment systems, then we need to break out these adjustments. I would be happy enough with a toggle or a switch. Let me toggle between reasonable different ways of adjusting for quality to see how the shape of the number changes. Let’s acknowledge that these changes mean different things to different people based on your values, there is no one right number.
On Quality Adjustments For Longevity
Mr. Fractally Wrong then takes me to task because I said:
For instance, you will hear the claim, “of course the price index for cars should be quality adjusted, because a modern car lasts longer than the clunkers of the 1970s.” “That car longevity is not actually a quality adjustment…If automakers move the location of a part so it does not burn out so quickly, that is not measured. If a new turbo engine is rife with problems causing early burnout, that is not measured. For automobiles, only quantifiable changes, such as the extra cost of adding a platinum-tipped spark plug, are included.”
He then cites the BLS saying: “Changes in design or materials that affect the length of service, durability, need for repairs, or strength or performance of the item, such as stronger bumpers, HID headlamps, or flexible body panels.” And he adds, “Taking this document at face value, Fitzsimmons is simply incorrect that changes such as “[moving] the location of a part so that it does not burn out so quickly” are not included in quality adjustments.
First, he is citing a manual about CPI, when for our purposes we are talking about PPI, but the methodology is similar enough that we will roll with it.
More importantly, either Mr. Fractally Wrong gets an F for reading comprehension, or the BLS gets an F for being misleading in how its high-level statements don’t match the details of what is doing.
As evidence for the BLS being actively misleading, a former BLS official responded on X.com in a conversation about quality adjustments to cars:

This is simply false! To make such a calculation the statistical agencies would need a crystal ball giving an accurate prediction of the lifespan of a 2022 car when it was built. The government bureaucrats would need to know if a new engine had notorious problems before even the manufacturer knew it! It is total absurdity!
Mr. Fractally Wrong hypothesizes:
manufacturers make design changes based on certain considerations and therefore should be able to estimate the effect of those changes on overall automobile lifespan.
But I actually did better than hypothesize, I actually emailed the BLS and asked them before writing my article, and they most certainly do not do this: “Perceived changes such as changes to claims made in advertisements or customer reports of a change in experience are not considered changes to the product and would not be grounds for any quality adjustment….In the PPI, quality adjustments are only applied on the differing measurable attributes of products. PPI does not quality adjust based on subjective claims by producing companies or perceived differences in user experiences, as those may differ based on the opinions or expectations of the users.”
CPI simply does not adjust for the predicted or actual lifespan of a car. If you read the documentation more thoroughly, what you understand is that they only adjust for the “embodied change in terms of resource costs” of something that might make the car last longer, such as the example I gave in my article, adding a platinum tipped spark plug, or that the BLS gives, adding a stronger bumper. In their examples on page 5, there are no adjustments listed for something like “increased longevity by 3 months” or for costless design changes that might increase longevity. The “moving the location of a part” would not be taken into account as long as it was a costless change. If the car company had simply learned from experience that they needed to move the part, and it did not increase their costs at all, there would be no quality adjustment.
Most improvements to longevity are not due to some explicit change like adding a platinum spark plug, but due to slow design and process improvements – gradually improving manufacturing precision, parts moved slightly to be less likely to burn out, finding better suppliers, better quality control, etc. etc. If you look at the examples of quality adjustments given in their documentation, these kinds of adjustments are not included.
Even when something longevity related is explicitly accounted for, the cost of changing the feature may have a disproportional change to actual lifespan. A relative improvement in one part of the engine that was a weak link might have a dramatic improvement in lifespan. Conversely, new engine models designed for fuel efficiency (such as turbos and CVTs) are notoriously causing early power train malfunction problems in ways that the BLS simply does not and cannot measure. Measuring the resource cost of a change that might impact longevity is a very different thing than actually measuring changes in longevity!
The entire conversation is basically:
Statistical agencies: Cars objectively last a lot longer, so it makes sense to do quality adjustments to take into account that a 2023 car lasts 25% longer than a 1997 car.
Me: OK, so that is how the quality adjustment is done?
Agencies: Oh, no, we can’t do that, so we measure a bunch of other things instead, and we kind of hope it all evens out and generally looks right.
As for poor documentation, what it would be lovely to see is an actual breakdown of average car price by type of car, and then layer on the quality adjustments. OK, add the durability adjustments, how much does that count for? Gas mileage improvements? Add the safety adjustments? Now add the luxury and convenience features like power lift-gates and heated seats. That is my bare minimum for transparency. Even better would be to have everything in github and reproducible, perhaps with a 5-year delay to assuage concerns about manufacturers revealing trade secrets.
While the PPI does actually publish the dollar amount of the quality adjustments for motor vehicles each year, the numbers don’t add up in a way that can be reconciled with the overall change in prices or the price index. Nor are the adjustments broken out into safety versus durability versus luxury.
On the Objectivity of Quality Adjustments
Mr. Fractally Wrong goes on to say:
Implicitly, Fitzsimmons appears to be characterizing quality adjustments as essentially arbitrary, as though BLS economists choose relevant product characteristics at random. However, glancing at Quality Adjustment in the CPI, we see that this is patently untrue: the vast majority of goods have no quality adjustment whatsoever, and the remainder are mostly split between hedonic adjustments and cost based adjustments.
For measuring manufacturing, we are using the Producer Price Index (PPI). When writing my original article, I emailed the BLS and asked them if they had a list of which categories were quality adjusted, similar to CPI. They did not provide a list and replied that “all Producer Price Indexes are subject to quality adjustments.”

They do document the CPU hedonic models and some of the car quality adjustments. But they do not document the breakdown between longevity and comfort changes. And in other categories, we are in the dark. For example, the aerospace category shows big improvements in gross output even as Boeing is making fewer planes. What are the extent of quality adjustments here? What is the data with and without them? How to account for the “value” of military planes when the government is the only buyer? Maybe there were minimal quality adjustments, and the U.S. really did make more jet engines and valuable aerospace equipment, Boeing’s troubles notwithstanding. But what is the point in anyone citing these aggregates in arguments when the people citing them do not even know what is going into them?
Mr. Fractally Wrong goes on to a discussion about methodology changes in the adjustments for microchips:
Finally, Fitzsimmons accuses the researchers of “changing the methodology after-the-fact because the numbers look wrong.” What, exactly, is the alternative here? When BLS researchers notice unusual trends in PPI data, should they uncuriously ignore such trends and keep on mechanically calculating quality adjustments even as the outputs seem to become increasingly divergent from reality? Presumably not. Byrne et al. is a 57-page paper with copious subanalyses and statistical tests; has Fitzsimmons engaged with this work in any substantive manner? No; instead he would rather accuse the researchers of massaging the data to fit their preconceived intuitions.
To clarify, the problem is when you change the methodology after the fact because the resulting numbers look wrong. Because that means you have some other idea in your head of what the number should be. But the entire point of an objective, data driven calculation is to develop the methodology that is most logically reasonable, and then let the numbers say what the numbers say.
In fairness, there are certain scenarios where you develop the methodology purely based on what is reasonable, run the data, and it looks screwy, and so then you look again at the methodology and you find some logical flaw. But this is a very dangerous practice. In a very complicated calculation it is very easy to only find the flaws when it doesn’t fit your conceived notions, and then you end up fitting to the result. And when there are many plausible choices it is almost a certainty.
And in this 57 page paper, they continually adjust the methods of how they are measuring the processing speed, and then run the method and see the result! The number comes out very high, and then they add an additional property of the processor and run it again. Now in fairness, the original switch from overlap to hedonics, they do come up with a solid logical reason why overlap pricing was no longer valid. But would they have looked for such a reason if the numbers didn’t “look wrong”? Is there always some valid reason lurking available that can be used to make the numbers look as expected?
This is a cousin of the great harm that has destroyed academia, which is called p-hacking.
In p-hacking, an academic wants to get some correlation result that they can be confident of to the 5% level. Then, they run dozens of different regressions, testing all different variants and controls, until they get the result and publish that. But – if you cut the data 20 or 30 ways, then by probability you are very likely to get a spurious 5% result! So the entire endeavor is basically fraudulent. However, some academics seem to do this completely unwittingly, to them, this is just how scientific publishing works, you look for signals in the data and publish it, what’s wrong with that?
The various adjustments made to GDP amount to the same thing. There is an expansive array of plausible adjustments, they try them out, and when it looks right they choose it. And “right” here is very likely, “doesn’t get me in trouble with the general public, doesn’t make numbers look ridiculous, and is enough to satisfy gods like Alan Greenspan.” Also very importantly, the same agency is both making these adjustments to the price indexes used by the GDP and by the CPI, and CPI is used for social security wage adjustments. So if you make the adjustments too high, you blow up the budget, too low and you have tens of millions of angry voters.
Thus no longer is the GDP objective data that informs consensus opinion about the economy. It is a construct that by design and process will reflect whatever the consensus already is.
Are the economists cackling evilly as they consciously fit the numbers to a desired result in order to further the agenda of their bureaucracy? No. They are probably doing this thing that is akin to p-hacking without quite realizing it. Many academics apparently do p-hacking without even realizing that it is wrong. But, that does not make them blameless, and that does not mean our very harsh rhetoric is unfair. When you advertise your credentials and expertise and length education, you don’t get to fall back on ignorance as an excuse.
There is one thing I did get wrong – on further reflection and study, it wasn’t actually the choice to use overlap versus hedonics in semiconductors that has been responsible for smoothing out the numbers so that they look more reasonable. Using hedonics instead of overlap from 1997 to 2010s probably wouldn’t have made an enormous difference, and so that change was not as important as I thought. It’s actually the use of the Fisher indexes. Going into Fisher indexes would be too much for this already too long article, but I hope to have more to say about them in the future.
Here is a puzzle for the reader. Brent Moulton, the former head of the GDP calculation, tells us that processors are adjusted based on computing power, twice the computing power means twice the gross output in the data. Yet, when we look at gross output for semiconductors (remember! Gross output is quality adjusted for processing speed), we see that from 1997 to 2024 it has only grown 262%, during a time when CPU processing has grown in the ballpark of 150,000% and CPU production was also up. Why this difference? You can try out your answer in the comments.
And this is really the problem with including quality adjustments in aggregates. Telling me that the output of computer CPUs has increased 95% and telling me that market share for top-line fabrication machines has changed from X% to Y% and then telling me the averaging processing power has increased from 150,000% tells me a lot about the world. Telling me that semiconductors’ real gross output is up 262% tells me absolutely nothing. It is simply useless knowledge, so many things are compressed into it, so many adjustments, the number becomes useless.
Now you may ask, wait a second Patrick – if from a purely objective standpoint the quality adjustments to semiconductors or cars are underdone, how is GDP overstating manufacturing?
Well, here it is, if cars were adjusted for horse-power-longevity-years and total processor-instructions-per-second output was truly 300,000% higher as a result of increased production of processing-power, the numbers would be so off the charts, especially from microprocessors, that it would be instantly obvious to everyone looking at it that we need to separate out a measure of quality from measures of quantity. The entire number would just be utterly ludicrous. “Real Output” would be off the charts, change in microprocessors would completely overwhelm every other number that the number would just be a measure of transistor growth, and “Real Value-Added” would literally be undefined! Then by being forced to split out the numbers, Americans would have a much better sense of the actual decline in quantity, and pundits wouldn’t be dunking on the American people.
On the other hand, if they removed quality adjustments entirely, it would show that GDP growth overall, and in manufacturing, were way lower than thought, and they would be under all sorts of pressure to make the numbers look better. After all, it is true that the processors and cars we produce today are a lot higher quality than what we made in 1997. The former head of the BEA discusses this exactly, in the 1990s the BEA got pressure to include better quality adjustments for technology, but the pressure they responded to was not from the president, who they could resist, but from Alan Greenspan who was like “a god”.
Mr. Fractally Wrong says that actually the quality adjustments are quite “conservative” and other commenters criticized me saying that actually, “Quality improvement is notoriously insufficiently factored into GDP.”
That supports my claim that the adjustments are subjective! That supports the claim that it is not possible to sum the economy into a single number, and if we do, we should at least have large error bars and toggles for different assumptions!
Either removing quality adjustments entirely, or fully unleashing them, and thus making the number look unreasonable, or adding giant error bars, would harm the central myth of the BEA, the stewards of the magical GDP, who are renowned for summing the economy into simple numbers.
As my friend put it when I was working through my article with him:
“We are going to inject hedonism as a relevant metric into national economic statistics, but only a little bit because hey we don’t want to get too crazy here” is like the maximally indefensible position.
Exactly.
On the sector-by-sector view of manufacturing decline
The final section of Fitzsimmons’s article, “American Decline Sector After Sector,” is a whirlwind tour of grim anecdotes: CPUs, LCDs, autos, solar, batteries, drones, ships, Boeing, machine tools, and pharma. The first problem here isn’t even that each sentence is false; it’s that the list freely mixes quantities (units/tons), nominal trade balances, and index numbers, swaps between global capacity shares and domestic value added, and attempts to overwhelm the reader with a barrage of negative mood affiliation without making any attempt at formulating a precise argument….It’s genuinely unclear what Fitzsimmons is arguing for here. He first acknowledges that CPU production and quality have clearly increased since 1997, but then complains that Taiwan produces more than the U.S. Why should the U.S. necessarily make the highest numerical quantity of semiconductors when compared to all other countries? He seems upset that American fabs only produce 12% of chips worldwide — but what is the right proportion for American fabs to be making? As industries develop and globalize, it’s natural for domestic manufacturing to wax and wane; is Fitzsimmons’s position essentially that in an ideal world, the percent of worldwide output manufactured within America in any given product category should only increase over time?
Let me put it this way: I consider manufacturing to be in decline if America is worse in per-population production than it was decades ago in the big first-world industrial goods (like planes and ships and cars), even if the quality of those goods has improved in line with global standards. It is in decline if America was once the global leader in a highly-changing field but now has dropped back in rank (even if the level of production in America is higher than it was in 1997). I consider it decline if America was once a premier global exporter, and has become a substantial net importer. That is decline, even if the raw amount of processing power or battery-kwh produced has grown.
The whole argument from the “manufacturing at record highs” crowd is that we make fewer consumer appliances, but we make up for it by being global leaders in the high tech stuff. But if we no longer make the best computer chips either, or we have missed out on the extremely important industry of batteries, and we don’t make smartphones, then that argument is just wrong. The fact that lithium battery production in terms of kwh might be 10,000% (I just made up that number) since 1997 does not outweigh the fact that United States market share has dropped to such low numbers.
Thus, to the best of my ability to pull together very patchy data, we are behind in almost every sector either by the standard of making things, or by the standard of keeping our global ranking in a high-tech field. The only exceptions appear to be medical equipment and space launch capacity. I might also make an exception for automobiles where there is an argument that increased longevity de facto means production of car-years is keeping pace with the needs of a growing American population. Medical equipment and Space-X are not nothing, but does it mean we shouldn’t be concerned with decline in all the other sectors? I don’t think so.
I’m not sure if Mr. Fractally Wrong actually disputes any of the data. So at the end we have a debate over what it means for manufacturing to be in “decline.”
He claims that the “lone bright spot is medical equipment and supplies, which is up 45%,” then immediately contradicts himself by saying that “production of rockets and space-lift capacity” is self-evidently better than it was 25 years ago.
“Medical equipment” was the lone bright spot in the remaining categories that are listed in the real gross output categories. Manufacturing of space-lift capacity is not something the GDP numbers track.
Amusingly, Fitzsimmons continues to inveigh against the validity of gross output measures all while using them to support his claims. He writes that “real gross output numbers can mislead if vertical integration reduces double-counting,” almost as if we might prefer to separate out the value added by the manufacturing process from the starting value of the inputs used — a concept which Fitzsimmons earlier decried as nothing more than “A Fictitious Measure of Output With No Meaning!”
Yes, the real value-added numbers are useless, so the best we can do is “real gross output” and then think about the inputs separately. News reports over the years have made it pretty clear U.S. manufacturers have outsourced their inputs, so “real gross output” is therefore an upper bound on the number we want. So if the real gross output numbers look bad, and they are the upper bound, the results are indeed grim.
The particular statistics Fitzsimmons chooses vary wildly from sector to sector, and in many cases simply appear to be straightforwardly uninformative….nd one might productively ask — why does he stop the comparison in 2014? Why does his comparison of solar panel market share begin in 2008?
My plea, your honor: guilty, guilty as charged. It is absolutely a travesty that the United States does not have comprehensive statistics on questions like “number of planes” of each market segment produced per year, total jet engines produced, total thrust power of all jet engines, market share in jet engines, number of server CPUs produced, total processing power of all CPUs, etc. etc. We could really use an agency to do this … maybe we could call it the Bureau of Economic Analysis? But that would require them to stop playing with spreadsheets with their friendly colleagues in this Quixotic attempt to aggregate quantities and qualities across sectors into aggregate numbers, and actually do a lot more hard shoe leather doing technical integrations with factory ERP systems. Despite my harsh words, I don’t want to fire these guys, but I do want to light a fire under their butts.
The data I pulled together is highly, highly imperfect. It should be seen as the start of the debate. Once we have realized that the high-level gross output and “real value added” numbers are misleading us, we actually need to roll-up our sleeves and think about these things, rather than being pacified by these aggregates with grandiose sounding names.
On “Fitzsimmons simply doesn’t seem to believe in international trade”
My article was not really about why we should care about manufacturing. And I don’t think we really need to make our own socks and jeans. Although we maybe should make the sewing machines, and definitely we should make the machines that make the sewing machines.
I hope to have a longer article on this topic, but in brief:
1. Manufacturing is what separates the quality of life of the modern world from the drudgery of, say, living in 1st century Rome. Without the manufacture of antibiotics, precise medical equipment, diagnostic tools, etc, there is no modern healthcare. Without farm machinery and construction tools, 90% of us would be doing back-breaking-labor like the slaves of antiquity. Without the machinery to extract it, oil in the ground is worthless.
2. The U.S. is currently running up huge trade deficits in manufactured goods, by exporting its own currency. It can do this because it is the global reserve currency. It is the global reserve currency because it won World War II. It won World War II because of being the greatest manufacturing power. See the problem?
3. I want the U.S. to be on the forefront of technological and economic greatness. What worries me most is reading articles saying, “Apple can’t open a factory to make Mac’s in the United States because they can’t find a company to produce custom screws on short notice.” What is required is a density of manufacturing power great enough so that you have the talent, resources, and flexibility, to generate leading-edge products.
“In the end, Fitzsimmons is basically anti-capitalist: he believes that we should produce everything, and to hell with the economic consequences.” (via X)
Once someone is throwing around one of the “c” words (communist, capitalist) the debate has certainly become bad faith and tedious. Should I retort that he must be a market fundamentalist who believes whatever outcomes markets produce is always the right one?
I very much like markets, property rights, and the joint stock corporation.
However, it is also true that in any body–a corporation, a nation, a family–smaller parts can optimize for local optimums that hurt the whole. And this is especially true if another great power is essentially bribing smaller constituent parts of America into optimizing for the other nations interests, instead of American interests. The art of corporate leadership or national leadership is being able to identify these problems and find fixes.
But at any rate, my article was not about industrial policy and nothing in it should be considered an endorsement of any particular industrial policy, nor even an endorsement of the idea that the American political system in the year 2025 can successfully implement an industrial policy.
The point of the article was to get smart people to stop being blinded by fatally flawed aggregates, to spur investigation into the underlying numbers, and to raise demand for better data that actually address the most critical questions of American manufacturing potency.
That concludes this response. I am happy to answer questions and respond to constructive criticisms in the comments.